Database Links

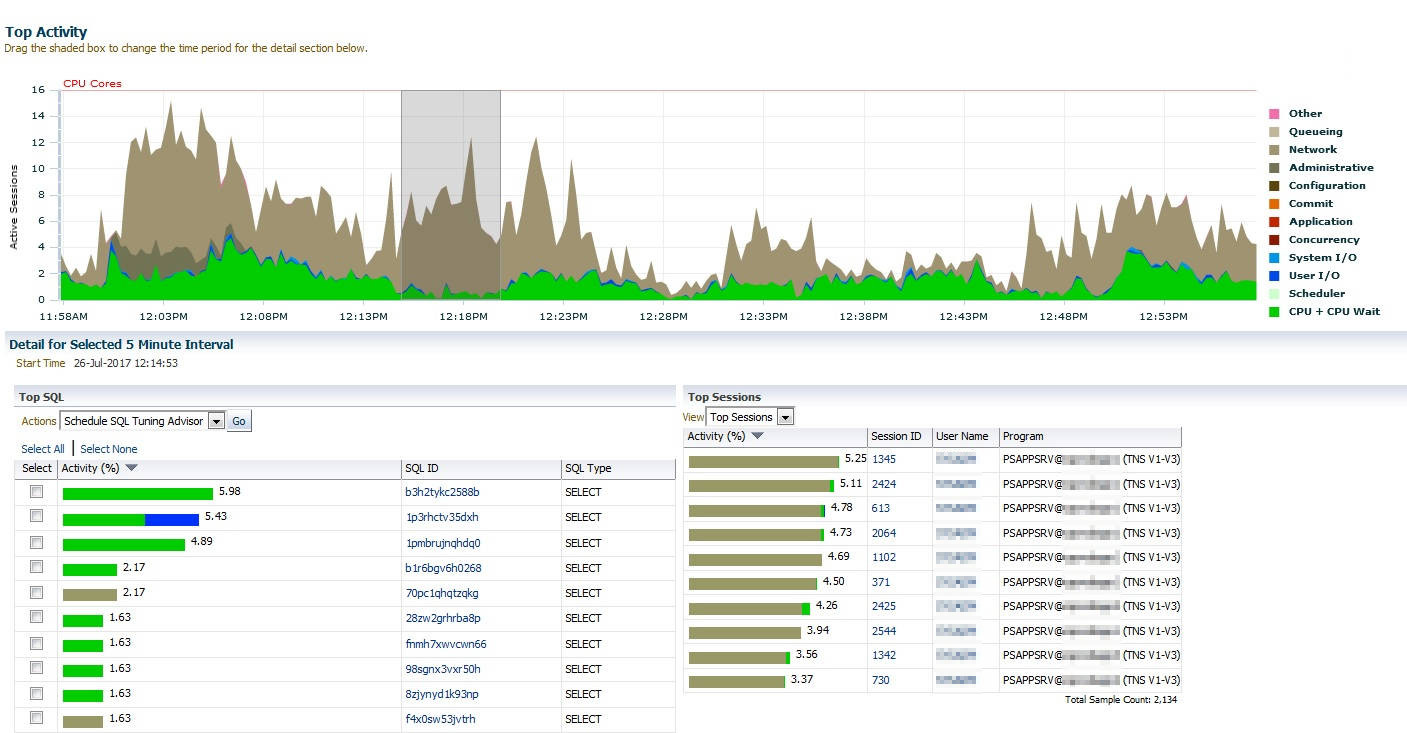
Our PeopleSoft system suddenly started showing spikes in network usage. Users were complaining of slow performance. Enterprise manager shows big spikes in network waits. Strangely these don’t seem to be reflected in the SQL. The table on the left doesn’t have as much beige/grey as the one on the right.

Oracle enterprise manager showing network waits

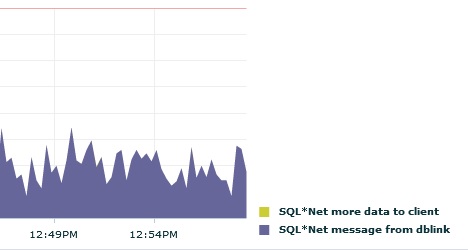
Lets click on network and see what the waits really are. SQL*Net message from dblink.

Oracle enterprise manager drilled into network waits

Ok brilliant. It is confusing why we don’t see it reflected in the SQL, but we know it is a dblink that is slowing things down.

So lets have a look in the v$active_session_hist table.

 1
 2
 3
 4
 5
 6
 7
 8
 9
10
11
12
13
14
15
16
17
18
19
SQL> set null <Null>
SQL> select sql_id from V$ACTIVE_SESSION_HISTORY
     where wait_class = 'Network'
     and event = 'SQL*Net message from dblink'
     and rownum < 10;

SQL_ID
-------------
<Null>
<Null>
<Null>
<Null>
<Null>
<Null>
<Null>
<Null>
<Null>

9 rows selected.

This is really confusing. We are waiting on a database link and there is no SQL running?

Trace to the rescue

PeopleSoft uses a pool of application servers. This is what the PSAPPSRV processes are which we can see on the right in the first graph. So to see why they are slow, maybe I can trace one and it will tell me what it is waiting for.

Thanks to Tim Hall at Oracle Base we can see a large number of ways to trace a session. I picked an application server process pretty much at random and found the serial number using the command below, then started tracing.

1
2
3
4
5
6
7
SQL> select sid, serial# from v$session where sid = 1234;

       SID    SERIAL#
---------- ----------
      1234      98765

SQL> EXEC DBMS_MONITOR.session_trace_enable(session_id=>1234, serial_num=>98765);

After a while I had a large trace file. I always take a quick look inside first to see if there is anything obvious. I could see lots of waits:

 1
 2
 3
 4
 5
 6
 7
 8
 9
10
11
12
13
14
15
16
17
18
19
20
*** 2017-07-24 12:18:57.866
WAIT #139807329682784: nam='SQL*Net message from client' ela= 1830362 driver id=1413697536 #bytes=1 p3=0 obj#=0 tim=23515353134788
CLOSE #139807328707176:c=0,e=4,dep=0,type=3,tim=23515353134827
WAIT #0: nam='SQL*Net message to client' ela= 1 driver id=1413697536 #bytes=1 p3=0 obj#=0 tim=23515353134840
WAIT #0: nam='SQL*Net message from client' ela= 274 driver id=1413697536 #bytes=1 p3=0 obj#=0 tim=23515353135119
PARSE #139807322931536:c=0,e=3,p=0,cr=0,cu=0,mis=0,r=0,dep=0,og=0,plh=0,tim=23515353135134
WAIT #139807322931536: nam='db file sequential read' ela= 9 file#=3 block#=934800 blocks=1 obj#=0 tim=23515353135205
WAIT #139807322931536: nam='SQL*Net message to dblink' ela= 0 driver id=675562835 #bytes=1 p3=0 obj#=0 tim=23515353135248
WAIT #139807322931536: nam='SQL*Net message from dblink' ela= 130533 driver id=675562835 #bytes=1 p3=0 obj#=0 tim=23515353265797
WAIT #139807322931536: nam='SQL*Net message to dblink' ela= 0 driver id=675562835 #bytes=1 p3=0 obj#=0 tim=23515353265819

*** 2017-07-24 12:18:58.406
WAIT #139807322931536: nam='SQL*Net message from dblink' ela= 408569 driver id=675562835 #bytes=1 p3=0 obj#=0 tim=23515353674401
XCTEND rlbk=1, rd_only=1, tim=23515353674525
WAIT #139807322931536: nam='SQL*Net message to dblink' ela= 1 driver id=675562835 #bytes=1 p3=0 obj#=-1 tim=23515353674577
WAIT #139807322931536: nam='SQL*Net message from dblink' ela= 101322 driver id=675562835 #bytes=1 p3=0 obj#=-1 tim=23515353775913
EXEC #139807322931536:c=0,e=640830,p=1,cr=1,cu=6,mis=0,r=0,dep=0,og=0,plh=0,tim=23515353775972
WAIT #139807322931536: nam='SQL*Net message to client' ela= 0 driver id=1413697536 #bytes=1 p3=0 obj#=0 tim=23515353776010
WAIT #139807322931536: nam='SQL*Net message from client' ela= 283 driver id=1413697536 #bytes=1 p3=0 obj#=0 tim=23515353776316
CLOSE #139807322931536:c=0,e=3,dep=0,type=3,tim=23515353776333

Brilliant. So I can search to see what cursor #139807322931536 is:

 1
 2
 3
 4
 5
 6
 7
 8
 9
10
11
12
13
14
15
16
PARSING IN CURSOR #139807322931536 len=47 dep=0 uid=31 oct=42 lid=31 tim=23515026855827 hv=1542810346 ad='0' sqlid='8g5sad1dzaura'
ALTER SESSION SET NLS_NUMERIC_CHARACTERS = '.,'
END OF STMT
PARSE #139807322931536:c=0,e=17,p=0,cr=0,cu=0,mis=0,r=0,dep=0,og=0,plh=0,tim=23515026855826
WAIT #139807322931536: nam='db file sequential read' ela= 4 file#=142 block#=374550 blocks=1 obj#=0 tim=23515026855907
WAIT #139807322931536: nam='SQL*Net message to dblink' ela= 0 driver id=675562835 #bytes=1 p3=0 obj#=0 tim=23515026855946
WAIT #139807322931536: nam='SQL*Net message from dblink' ela= 1364 driver id=675562835 #bytes=1 p3=0 obj#=0 tim=23515026857322
WAIT #139807322931536: nam='SQL*Net message to dblink' ela= 1 driver id=675562835 #bytes=1 p3=0 obj#=0 tim=23515026857345
WAIT #139807322931536: nam='SQL*Net message from dblink' ela= 1556 driver id=675562835 #bytes=1 p3=0 obj#=0 tim=23515026858914
XCTEND rlbk=1, rd_only=1, tim=23515026858981
WAIT #139807322931536: nam='SQL*Net message to dblink' ela= 1 driver id=675562835 #bytes=1 p3=0 obj#=-1 tim=23515026859017
WAIT #139807322931536: nam='SQL*Net message from dblink' ela= 558 driver id=675562835 #bytes=1 p3=0 obj#=-1 tim=23515026859588
EXEC #139807322931536:c=0,e=3761,p=1,cr=1,cu=6,mis=0,r=0,dep=0,og=0,plh=0,tim=23515026859612
WAIT #139807322931536: nam='SQL*Net message to client' ela= 0 driver id=1413697536 #bytes=1 p3=0 obj#=0 tim=23515026859638
WAIT #139807322931536: nam='SQL*Net message from client' ela= 188 driver id=1413697536 #bytes=1 p3=0 obj#=0 tim=23515026859841
CLOSE #139807322931536:c=0,e=2,dep=0,type=1,tim=23515026859855

Alter session? That shouldn’t be slow. And why was it quicker this time? And where is it going to anyway?

lsof to the rescue

Oracle has a view which tells you which dblinks a session has open: V$DBLINK. The problem is that you can only run it in your own session. So that’s useless for me. Instead I have to resort to Unix tools. I found the server process that was running the session I was interested in. Fortunately in this situation I am not using multi threaded (shared) servers.

To identify the process on the server, we need to check the database. V$SESSION has process and machine, but that for the client, in this case the application server. I want the process on the database server, for which I need to consult V$PROCESS:

 1
 2
 3
 4
 5
 6
 7
 8
 9
10
SQL> select spid, traceid from v$process
     where addr = (select paddr
      from v$session where sid = 1234);

SPID
------------------------
TRACEFILE
----------------------------------------------
5678
/oracle/diag/rdbms/db/DB/trace/DB_ora_5678.trc

It also tells you where the trace file is. Handy.

After a bit of trial and error I found I could do the following to see which databases a process had open:

1
2
3
4
# lsof -p 5678 | grep TCP
oracle_71 5678 oracle   8u  IPv4 1521383844  0t0  TCP db***:47081->db1***.***.cam.ac.uk:random-service (ESTABLISHED)
oracle_71 5678 oracle  10u  IPv4 1521405726  0t0  TCP db***:63861->db2.***.cam.ac.uk:NNNN (ESTABLISHED)
oracle_71 5678 oracle  14u  IPv6 1521371866  0t0  TCP db***:another-random-service->app***.***.***.cam.ac.uk:NNNNN (ESTABLISHED)

I can see that the process has a connection to server db1 and server db2 in addition to the apps server which I already knew about. So these are the databases it is waiting on. So why is this?

I had a look on the remote databases, and also checked with the administrator of another one of them. We couldn’t see any performance problems.

So the problem is somewhere in between.

tcpdump to the resuce!

I am a database administrator, so I am really out of my depth here. I know very little about networks. After some searching I found the following is a good way to capture a network dump for later analysis. I think this records everything that goes through the network, so there is the potential for files to get very big very quickly. Also there is potential to make performance even worse.

1
2
3
4
5
# tcpdump -ni em1 -s0 -w db.pcap
tcpdump: listening on em1, link-type EN10MB (Ethernet), capture size 65535 bytes
^C414815 packets captured
415278 packets received by filter
455 packets dropped by kernel

Press ^C when there is enough data, and then download the file and open it with Wireshark.

As I say, I don’t understand what is going on here, but eventually I found that you can type things into the search box at the top:

1
ip.host contains db1

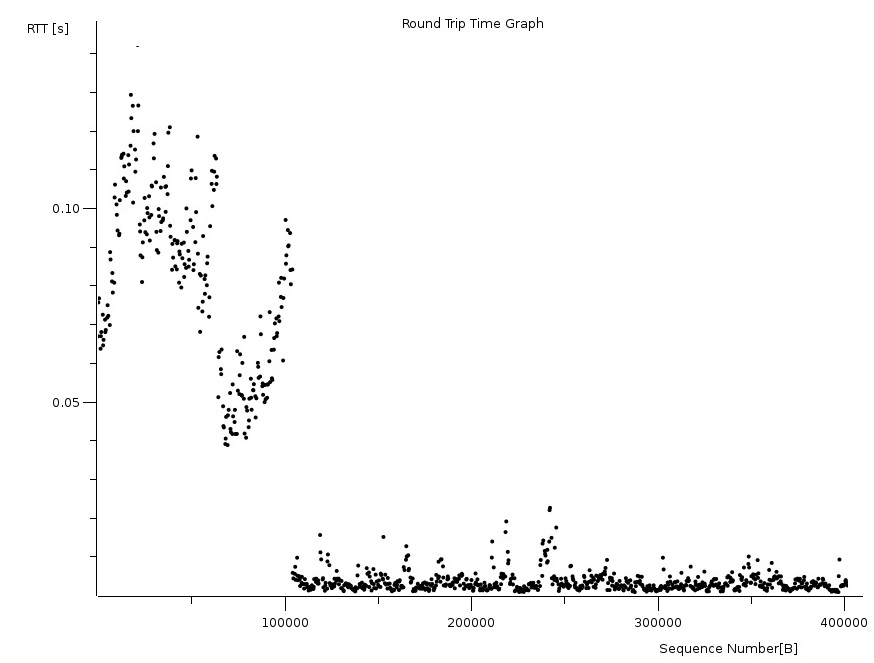
This shows all the communication between my database server and server db1. I get a load of lines I don’t really understand. Not terribly informative. However, I then found out that I can select statistics->TCP Stream Graphs->Round trip time

Round trip time graph from Wireshark

This was more interesting - a nice graph of the round trip time. It shows me what I already knew, that the communication was very slow to start with but then sped up dramatically towards the end of the trace. However, I could change the query line to db2, and it showed the same shape. Finally I changed it to app, and the graph was straight, the response was the same for the entire duration.

I am coming towards the end of what I can do, but I can infer a lot from this information.

  • The remote databases aren’t the problem (They are separate, so they don’t both slow down at the same time)
  • The local database server isn’t the problem (Because if it was the communication with the apps server would also slow down)
  • The switch isn’t the problem because the application server communication is OK.

In fact, thinking about it, things that go through the firewall go slow, and things that don’t are OK.

Maybe it is the firewall.

The firewall administrator checked and discovered CPU was rather high. He made a change to reduce it and all was well. The waits disappeared and users confirmed that the performance was much better.