PeopleCode Debugger - Setup and Diagnosis
The debugger requires application designer to be run in three tier mode, i.e. it should connect to the application server workstation listener rather than to the database itself.
We found that to achieve this we had to do the following:
On the application server, run psadmin, and administer the domain
where the debugger is to be switched on. As of tools 8.57 this is done
by choosing the following options from the menu. Note that the domain will be
shut down once the configure option is chosen.
1) Application Server
1) Administer Domain
1) APPDOM
4) Configure this domain
y to continue and shut down the domain
At this point the configuration menu is shown. Ensure the following options are configured. It seems WSL is short for Workstation Listener, and PC Debugger is short for PeopleCode Debugger.
6) WSL         : Yes
7) PC Debugger : Yes
Once this is complete, the domain can be configured and booted as follows:
14) Load config as shown
1) Boot this domain
1) Boot
We have a firewall between the application server and the desktop PCs, and found that the following ports had to be opened:
- 7000: For the Workstation Listener
- 7001-700n: For the Workstation Handlers. This depends on how many have been configured.
- 9500: For the PeopleCode Debugger.
The number of workstation handlers is configured in the psappsrv.cfg file in the Workstation Listener section. To start with we have the following:
So we need ports 7000-7003 open, as we have a maximum of 3 handlers. Looking at the netstat output below it seems that the highest port is used first.
Debugging the Problems
We seemed to get a lot of problems. Here are the issues we encountered and their solutions
Application server won’t start
The first time I started the workstation listener in our development environment, it didn’t start:
| |
The log files were extremely unhelpful. The only relevant messages were in the Tuxedo log file:
| |
The error message would be more helpful if it mentioned the IP address it was listening on.
There is a brief note at the end of Oracle support Doc ID 607604.1 which mentions that the hosts file may be wrong. Sure enough the IP address in the hosts file is not the same as the IP address of the VM. The WSL process is looking at this IP address and trying to listen on it, but it can’t as the IP address in question doesn’t belong to this VM. Once this was corrected, the WSL booted.
Checking the ports are open
Application designer still wouldn’t connect.
The Unix host has an IP address, but to route network communication to the correct program, it has a number of ports. It is possible to tell who is listening on each port using netstat. In the output below we can see under Local Address the ports being listened on, and the last column shows the program that is listening on this port.
| |
This proves that the workstation listener is listening on port 7003 (First line) and the work station handler is listening on port 7000. It is also interesting to note that while the Jolt Service Handlers are listening on all interfaces (ip address 0.0.0.0), the workstation listener and handler are listening on one interface with the IP address 10.0.99.99. This is why it looks in the hosts file to find the IP address as mentioned above.
Firewall
So having proven that the application server is at least listening on the correct ports, why can’t application designer connect?
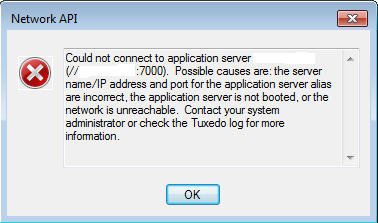
Ticking off the possible causes listed:
- server name/IP address and port for the application server alias are incorrect? No, they are correct.
- The application server is not booted? No I booted it.
- The network is unreachable.
I have a terrible feeling I am the system administrator, so I checked the Tuxedo log, but there was nothing useful in it. So we should check the network. In the old days we would try to connect using telnet, but this is often not installed any more. So on Linux I use nc as follows:
And on Windows I use
| |
We can’t connect to the application server on that port. It looks like a firewall issue. Once I asked the administrator to open ports 7000-7003 this test worked, and we could connect. However, our developers were getting the following error:
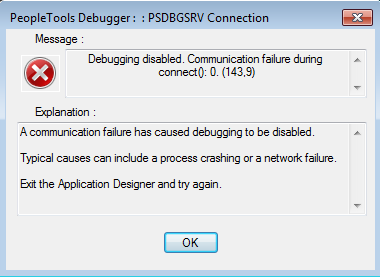
This was caused by port 9500 not being open for the developers. Once I asked the firewall admin to open the port, the developers were finally able to connect!
Setting Up Application Designer
It looks like it should work if you just type the name into the login screen, but I added the environments in configuration manager. Go to the profile tab, then edit the default profile. Add a connection of:
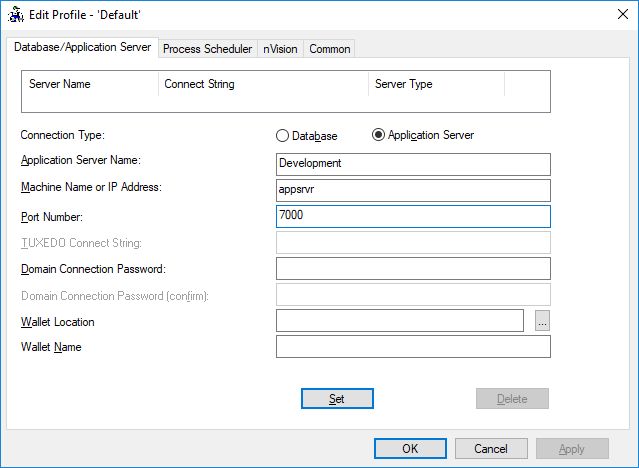
- Type: Application Server.
- Application server name is just a name (e.g. Development)
- Machine name: appsrvr (i.e. the hostname of your application server)
- Port: 7000 (This is the default)
- Leave the rest blank.
- Click Set to move it to the list.
A number of application servers can be added in this way for the user to pick the one they require.