SQL Tuning
SQL Tuning
As a DBA I find that people think I know about how to tune SQL. They present me with a query that looks simple, but on inspection has views on views on complex views, and has an explain plan of over 100 lines! It is difficult to know where to start, particularly when you don’t know what the SQL is supposed to be doing, or understand the structure of the data within the database.
Talk to the Developer
When presented with some slow SQL, the first thing to do is to speak to someone who knows what it is supposed to do. Ideally the person who wrote it or is responsible for maintaining it. It is possible that as they are explaining what it does, you will work out something that it is doing that it need not. Also as you talk about the way data is selected and how you would expect the optimiser to find the data, it might become obvious that the optimiser can’t do what they expected.
Explain Plans
While discussing the SQL with the developer, it is useful to have the explain plan to hand. Even better, a plan from an actual run of the SQL statement. If you are using SQL Developer, there are tools built in which make gathering this information easier.
SQL Developer
SQL Developer is based on Eclipse, and runs in Java. It has a reputation for being bloated and slow. However it does come with a number of useful tools for SQL tuning, which I describe below.
Explain Plan
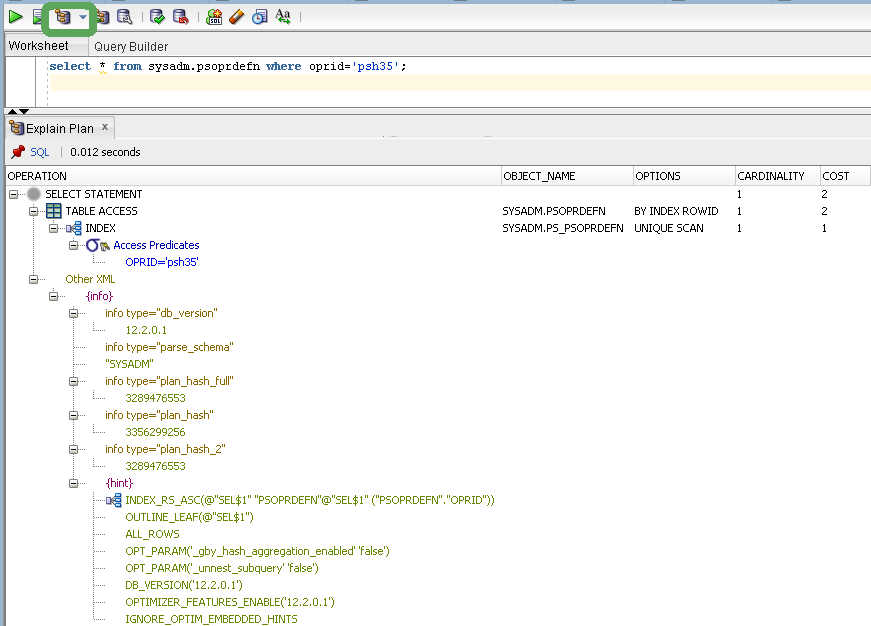
This generates an estimate of which execution plan the optimiser might use to get the data. The user can see the expected cardinality (i.e. expected number of rows returned by each step) and the cost (which should be proportional to the time it will take to run the step). The explain plan can be used as a guide which parts of the query are likely to run slowly. It contains a section containing a list of hints which should force the use of the plan, though data type conversions may mean that is not possible. The explain plan can be accessed by using the context menu (right click), or using the icon highlighted below.
Autotrace
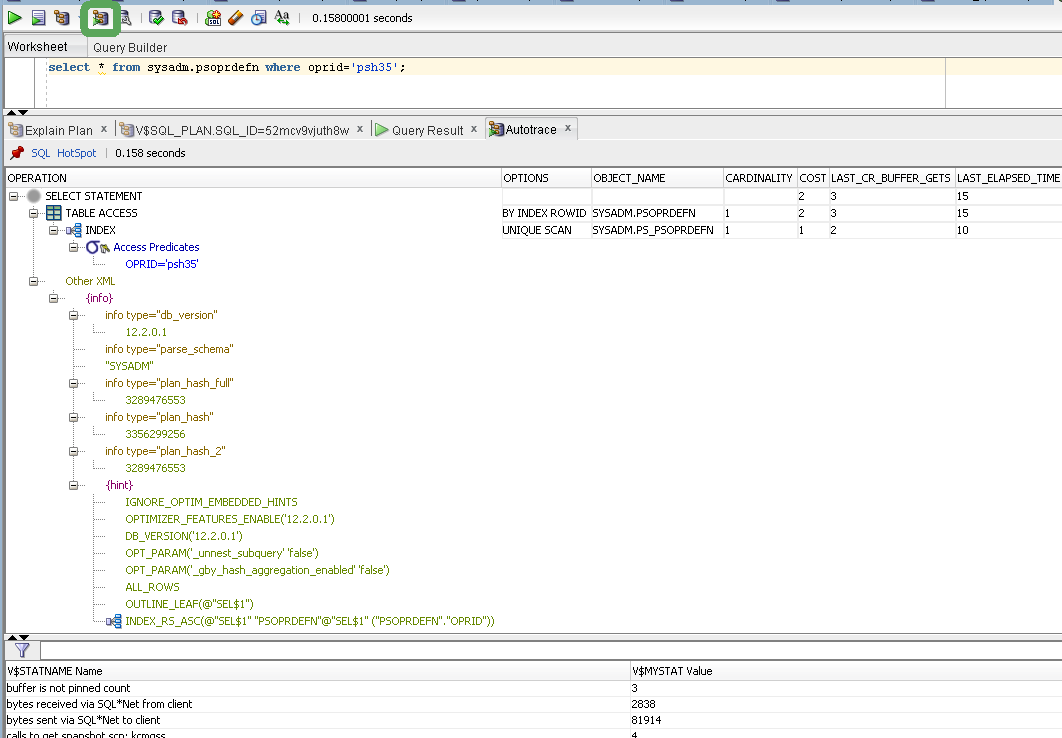
Autotrace actually runs the query. It reads the results from the database, but doesn’t display them. This means that the query generates all the load on the database, but none on the local PC. This solves the problem of a query appearing to run slow because SQL Developer is struggling to display all the results.
It returns resource usage statistics from the local statistics table, V$MYSTATS which shows the operations that were used by the
session. More interestingly though
the explain plan contains some extra information. LAST_CR_BUFFER_GETS and LAST_ELAPSED_TIME. These are actual statistics from the last run, so
more reliable than the cost and cardinality in the explain plan. It also contains the hints section like the explain plan.
The autotrace function can also be accessed from the context menu, or an icon next to the explain plan button as highlighted below.
Cursor Display
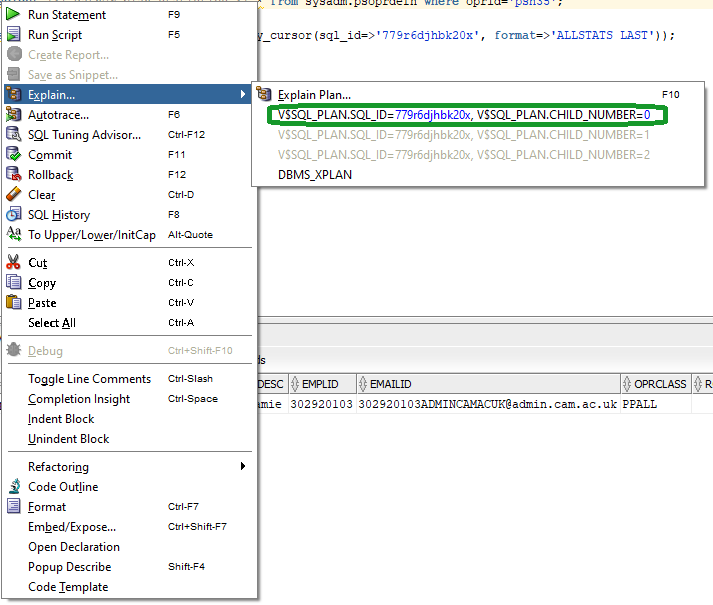
If the SQL has been run (by an autotrace or interactively) the cursor can be displayed. This is similar to the explain plan, but displays the
actual plan that the database used to gather the data. This can be selected from the Explain Plan menu, or the Explan Plan icon drop down menu. Select one
of the lines that starts V$SQL_PLAN.SQL_ID=, and isn’t greyed out. There are reasons why the same SQL can create different plans, e.g.
bind peeking or cardinality feedback. This is why there is more than one menu entry, though they are rarely populated. See the
screenshot below for an example of the SQL having been run.
DBMS_XPLAN
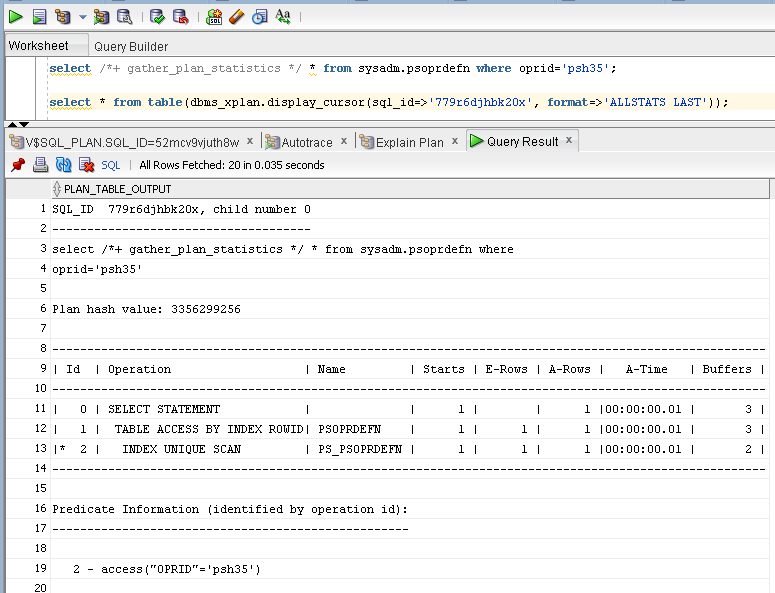
If the cursor has been run, it is possible to display it using dbms_xplan. This is better if plan statistics have been gathered, which can be done by adding a hint to the SQL
/*+ gather_plan_statistics */
This adds a little extra time to the execution, because it is recording statistics, but it is worth it, because of the extra detail that can be displayed. Bear in mind that changing an SQL statement, e.g. by adding the above hint will change it’s SQL Identifier, so the DBMS_XPLAN statement should be regenerated to show statistics from the new statement every time it is changed and rerun.
Notice the command to generate the report is entered into SQL Developer from the Explain Plan context menu. It will need to be run before the output can be viewed. This is particularly useful in working out where the optimiser went wrong, because it displays the expected rows and the actual rows. The rule of thumb is that if the actual number of rows is an order of magnitude different from expected rows multiplied by executions, the optimiser is likely to make a wrong decision about the execution plan. DBMS_XPLAN displays the time taken on each step, so is useful for focussing tuning effort.
To create the SQL to show the plan, select the DBMS_XPLAN entry from the explain plan menu. It is under the V$SQL_PLAN.SQL_ID= entries described
above.

Here is an example of the report displaying expected E-Rows and actual A-Rows rows. In this case, the optimizer was exactly correct!
Tuning and Diagnostic Pack Options
I am not an expert on licensing. It is worth satisfying yourself that you have an appropriate license for the features you intend to use. I believe all the tools described above can be used under the Oracle Enterprise Edition license. For those who have the Tuning and Diagnostic pack, there are some more useful features, and these can also be accessed using SQL Developer.
Real Time SQL Monitor
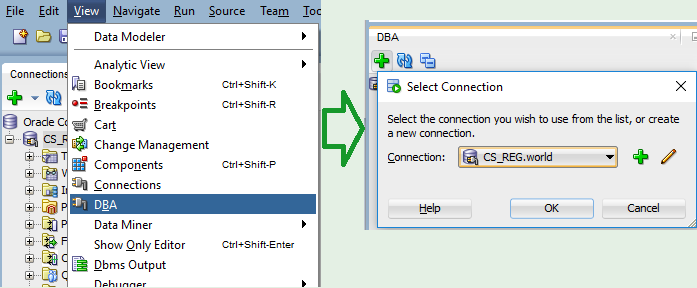
From the View menu select DBA. The DBA section will appear under Connections and Reports to the left of the screen. Click the green
Plus icon and add an (already created) connection to the list (or create a new one by pressing the green plus in the windows that appears).
Expand SID->Tuning->Real Time SQL Monitor. This displays the
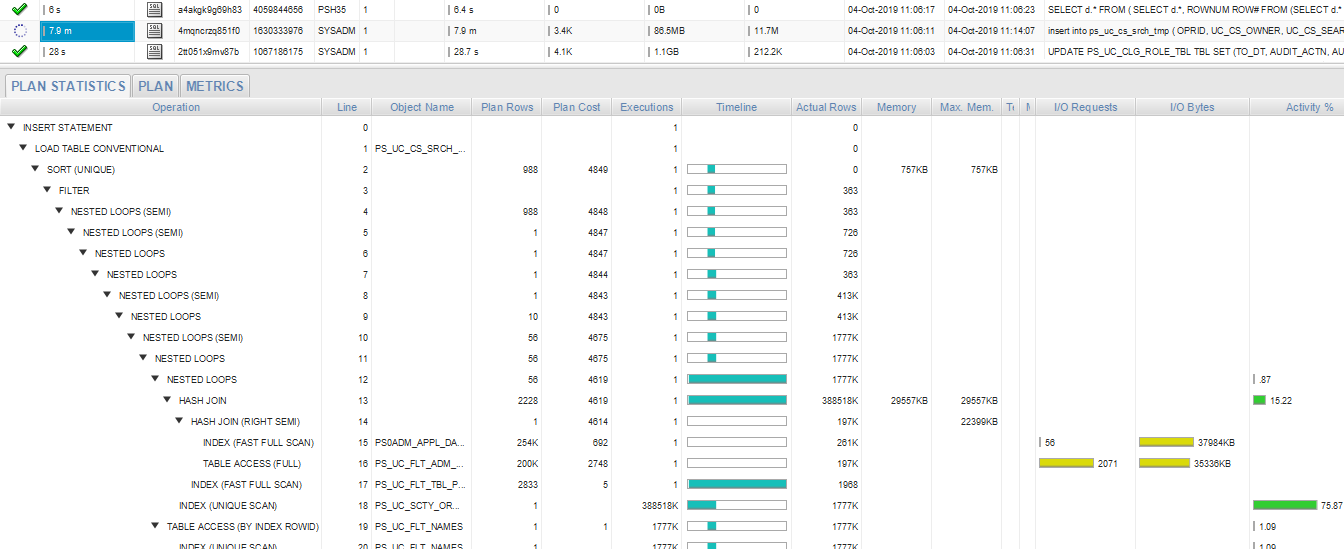
screen shown below. Currently running and recently completed SQL is displayed. Click on an SQL to display the plan statistics in the bottom half of the
screen. It might be necessary to enable tuning and diagnostic pack Tools->Prefereces->Database->Licensing
(so long as there is an appropriate license).
This contains the plan statistics. The timeline shows the parts of the plan that were running at different times. The number of bytes read can be an indication as to why a query is slow, e.g. if it has to read 2T of data and then returns 3 rows, there might be a more efficient way to gather the required data!
Instance Viewer
The Instance Viewer is also available from the DBA section under Database Status. It draws a pretty screen with some graphs of the general status of the database. The most interesting part for our purposes is the Top SQL section, which displays the longest running SQL in descending time order. Right clicking on an SQL gives a context menu from which it is possible to select Details.
The SQL Details screen that appears displays the SQL at the top, and a number of reports in the tabs below it. The Explain Plan tab displays pretty much the same plan as is generated from other options above, and doesn’t contain as much information. Bind Variables can be useful in reproducing a slow SQL run. SQL Tuning Advice runs an adviser, which can give useful advice on how to tune the SQL, e.g. missing indexes or statistics, expensive operations. Sometimes it generates an SQL Profile, which is an execution plan which the adviser considers is quicker than the one generated by the optimiser. This should not really be accepted by developers, it is better to work out why the optimiser is generating a bad plan and change the SQL or the stats so it creates a better one. It can be useful in production when a query is running slowly and a magic bullet is required!
If the magic bullet is used, remember that this will only work in the current database. Unless action is taken this information that made the SQL run fast in development won’t automatically move with the SQL into test and production environments.